
CRM Insights Overview
A deep dive into the numbers and charts that drive your WhatsApp sales performance.
The Insights view is the command center of The Chat Quotient. It shows actionable sales data — metrics, charts, and prioritised task lists — to give you a 360-degree view of your business without leaving WhatsApp.
To access Insights, click the Deal icon in the CQ sidebar. The Deals panel opens on the Deals (Kanban) tab by default; switch to the Insights tab to see the reports described below.
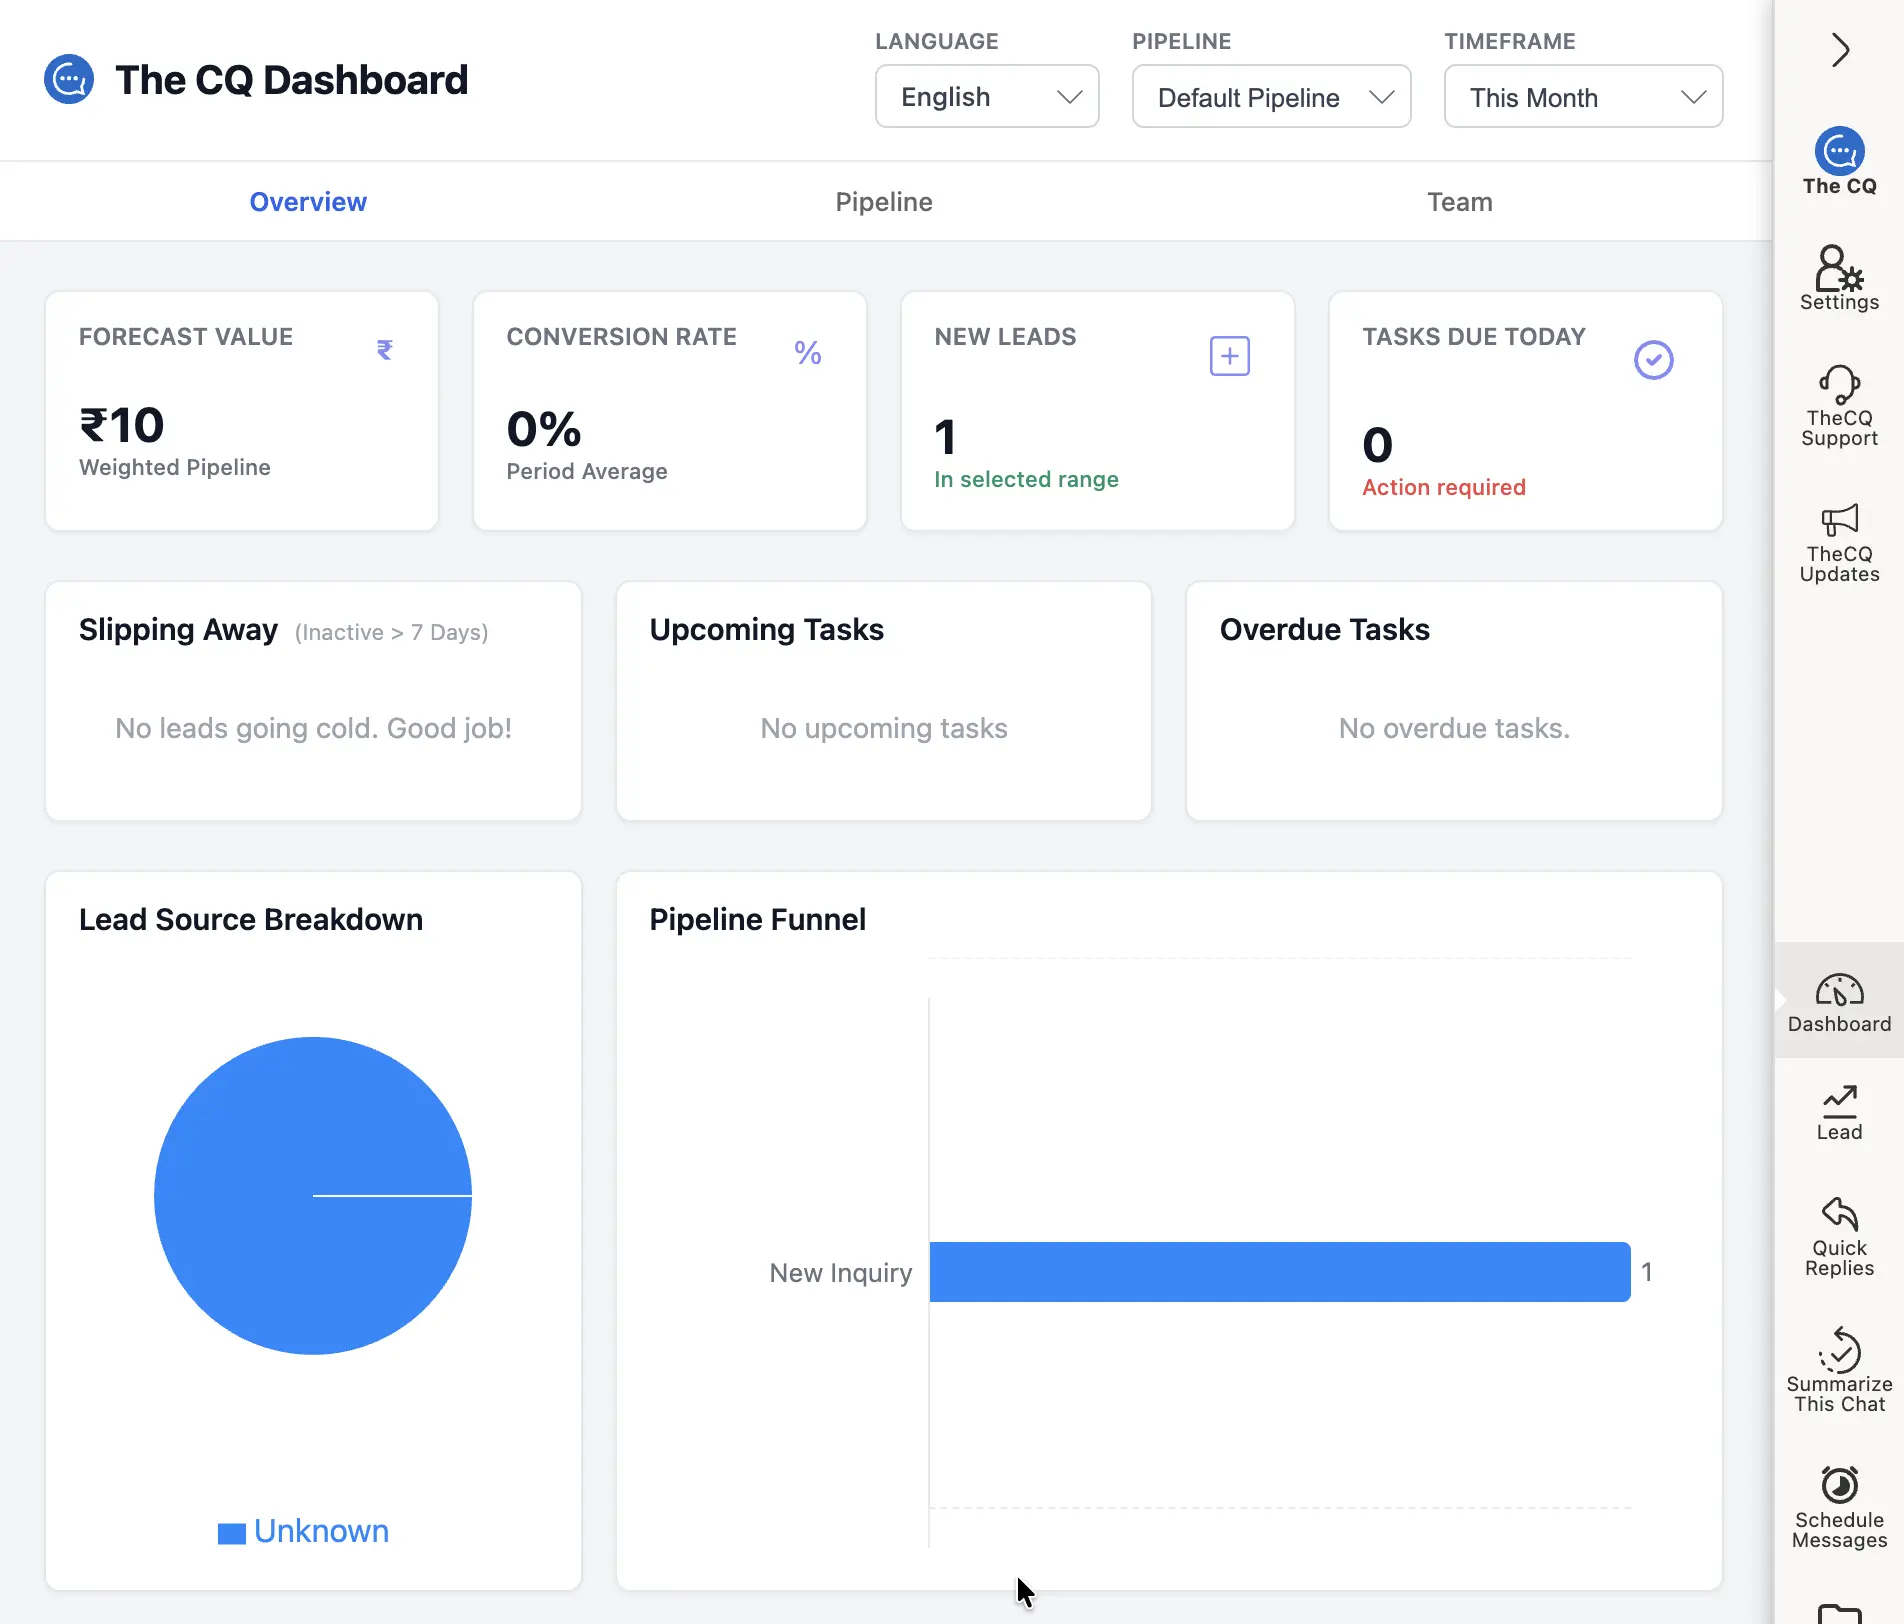
The Insights tab appears inside the Deals panel.
Top Controls

Use the top-right dropdowns to switch currency, pipeline, and time frame.
On the top right of the Insights view, you have three critical dropdowns to filter your view:
- Currency Selector: Switch your reporting to any local currency. We support all major world currencies and even popular cryptocurrencies.
- Pipeline Selector: Choose which pipeline data you want to view (e.g., “Sales” vs. “Recruitment”).
- Time Frame: Filter your reports by Day, Week, Month, or Year to track progress over time.
Key Metrics (The Top Four)

The four key metrics give you a quick pulse of your business at a glance.
The top section shows four high-level numbers to give you a quick pulse of your business:
- Forecast Value: This is your weighted pipeline value. If you have a $1,000 deal in a stage with a 10% probability, it contributes $100 to this value. It provides a realistic view of expected revenue rather than just the total “open” value.
- Conversion Rate: Based on the selected time frame, this compares your Won deals against Lost deals to show your team’s closing efficiency.
- New Deals: The total number of new deals added to your CRM during the selected time frame.
- Total Tasks Due: A high-level count of all tasks that are due for action today.
Status Columns

Three prioritized columns surface the deals and tasks that need attention.
Below the metrics, Insights organises your attention into three prioritised columns:
- Slipping Away Deals: Highlights deals that have not been updated or messaged in the past 7 days. These are your “cold” deals that need immediate re-engagement.
- Upcoming Tasks: A chronological list of your next scheduled actions.
- Overdue Tasks: Tasks that have passed their due date and require high attention.
Visual Reports (Charts)
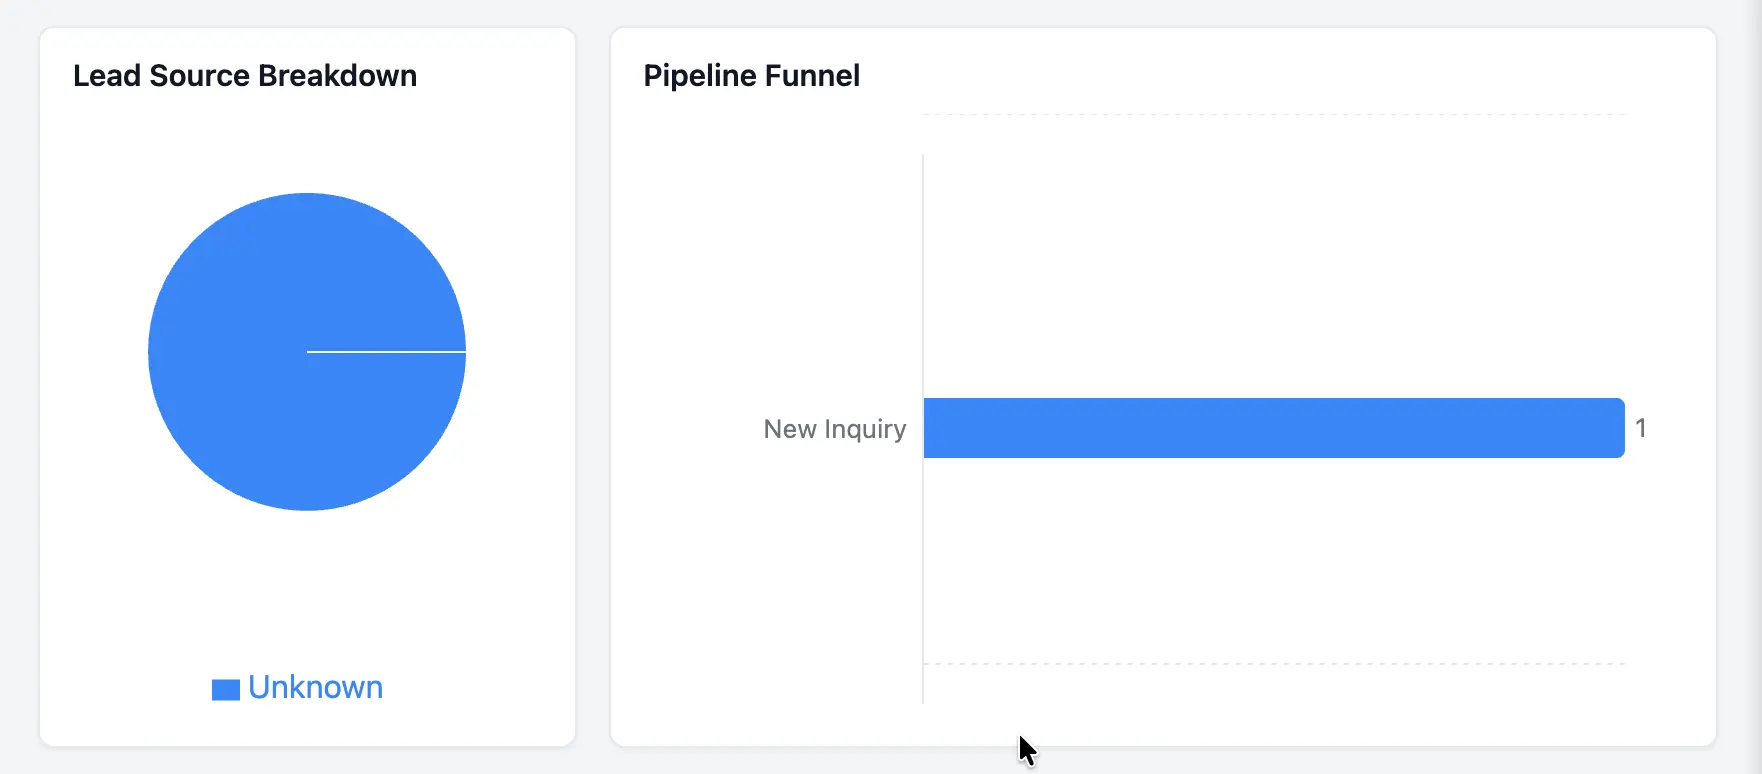
Charts show where your deals come from and how they move through your funnel.
To give you a 360-degree view, we provide two types of charts:
- Deal Source Breakdown (Pie Chart): See exactly where your deals are coming from (e.g., Referrals, Website, Instagram) so you know which marketing channels are working.
- Pipeline Funnel Chart: A visual representation of how many deals sit at each stage of your sales process, helping you identify bottlenecks in your funnel.
Switching Views

Toggle between the Deals (Kanban) and Insights tabs inside the Deals panel.
Inside the Deals panel, you can toggle between the Deals (Kanban) tab (your drag-and-drop board) and the Insights tab (charts and metrics) to manage your work in the way that suits you best.